The question behind the tool
Most developers experience process monitoring through ps, top, or htop. Those tools feel authoritative, yet they are themselves userspace programs that read interfaces the kernel already exposes. ProcWatch was built to answer a concrete systems question:
What does it actually take to reconstruct process information from the interfaces Linux provides to userspace?
The result is a lightweight C utility that enumerates processes, reads metadata and command lines, derives CPU utilization from successive samples, sorts by CPU or memory, inspects individual processes, file descriptors, and memory mappings, and handles the inevitable races that occur when processes disappear mid-inspection.
ProcWatch does not wrap existing tools. It observes /proc directly.
Architecture
The program is organized as a clear pipeline:
CLI → process collection → sampling → CPU calculation → sorting → display
Source modules:
main.c— argument parsing, operation selection, sampling orchestrationproc.c/proc.h—/procenumeration,statandcmdlinereading, process table, CPU calculation, sortingdisplay.c/display.h— table, single-process, tree, fds, and maps viewsutil.c/util.h— file reading, PID-directory checks, timing helpers, error reporting
The central structures are struct proc_info (one process) and struct proc_table (the collection). The table starts with capacity 512 and doubles on exhaustion up to a defined maximum. Ownership is explicit: the table owns the array of process records.
Collection, analysis, and presentation remain separated. Display never re-reads /proc; it operates on the in-memory model.
Why `/proc`
Linux exposes process state through a pseudo-filesystem whose contents are generated by the kernel on demand. Relevant paths include:
/proc/<pid>/stat
/proc/<pid>/cmdline
/proc/<pid>/status
/proc/<pid>/fd/
/proc/<pid>/maps
ProcWatch treats these files as the authoritative interface. It does not need internal kernel data structures; it consumes the representation Linux already makes available to userspace.
Process discovery
The program opens /proc with opendir() and iterates with readdir(). Only entries whose names consist entirely of digits are treated as candidate PIDs. Everything else (sys, meminfo, cpuinfo, etc.) is ignored.
A process may exist when its directory is discovered and vanish before /proc/<pid>/stat is opened. ENOENT in this window is treated as a normal race: the entry is silently skipped. Live systems change while they are observed.
Parsing `/proc//stat`
/proc/<pid>/stat is positional and unforgiving. A single skipped field shifts every subsequent value. Relevant fields include:
1  pid
2  (comm)
3  state
4  ppid
14 utime
15 stime
20 num_threads
22 starttime
23 vsize
24 rss
The second field, comm, is enclosed in parentheses and may contain spaces or parentheses itself. Blind whitespace tokenization is unsafe. The parser therefore locates the closing parenthesis with strrchr(), the opening parenthesis with strchr(), extracts the name between them, and only then continues positional parsing of the remaining fields.
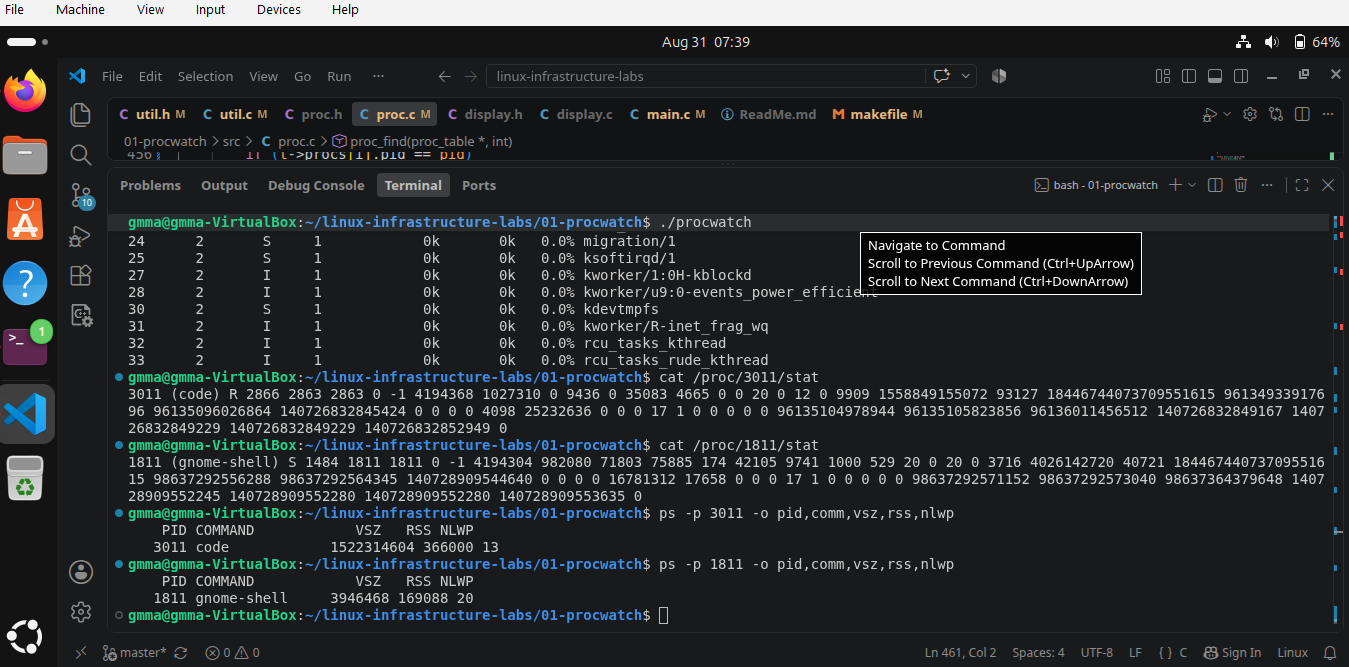
Early versions of the parser produced absurd values such as multi-petabyte VSIZE figures. Direct inspection of the raw file and careful field mapping corrected the skip counts. After the fix, ProcWatch’s numbers were consistent with both the raw kernel text and ps.
RSS is reported in pages; conversion by the system page size yields bytes. VSIZE is reported in bytes. These units must be handled explicitly.
Virtual size versus resident size
A process can report a multi-terabyte virtual address space while consuming only a few hundred megabytes of resident memory. VSIZE reflects the size of the virtual mappings; RSS reflects pages currently resident in physical RAM. The large values are not parser errors—they are real virtual-memory accounting. Distinguishing “unexpected” from “incorrect” required comparing ProcWatch output, the raw /proc record, unit conversion, and ps side by side.
Command lines and kernel threads
/proc/<pid>/cmdline stores arguments separated by NUL bytes. A helper converts the NUL-separated sequence into a space-separated string for display. Kernel threads often have an empty cmdline; in those cases ProcWatch falls back to the comm name extracted from stat.
CPU utilization
CPU percentage cannot be read from a single snapshot. The kernel supplies cumulative counters (utime + stime) in clock ticks. ProcWatch therefore:
- Takes sample A for every process.
- Sleeps for a configurable interval (default 1 s).
- Takes sample B.
- Computes the delta in ticks, converts to seconds using
sysconf(_SC_CLK_TCK), divides by the measured wall-clock interval obtained withclock_gettime(CLOCK_MONOTONIC, ...), and scales to a percentage.
The resulting metric is derived, not supplied. This is the same pattern used for network rates, disk I/O rates, and most observability systems: sample, difference, normalize by time.
Sorting, filtering, and specialized views
Sorting uses qsort() with comparators for CPU percentage and RSS. The CLI supports:
- default CPU-sorted listing
--top cpu|memory--pid PIDfor single-process inspection--treefor hierarchy--fds PIDand--maps PID--intervaland--limit
Argument parsing is performed with getopt_long().
Build system and quality constraints
The project is built with GNU Make. Sources compile to object files under obj/ and are linked into a single procwatch binary. Compiler flags are:
-std=c11 -Wall -Wextra -Wpedantic -O2 -g
Development encountered classic Make pitfalls—missing tab separators, malformed pattern rules, and the case sensitivity of makefile versus Makefile—as well as C issues around feature-test macros, missing headers for exit(), and the obsolescence of usleep(). The preferred interval primitive is nanosleep().
Warnings (assignment-suppression length modifiers in sscanf, potential snprintf truncation) remain documented technical debt; they do not prevent a successful build.
Operational behavior and verification
Process disappearance between enumeration and open is expected. Permission and existence failures surface clearly. The validation workflow used throughout development was:
make clean && make
./procwatch
./procwatch --pid <pid>
cat /proc/<pid>/stat
ps -p <pid> -o pid,comm,vsz,rss,nlwp
Agreement among ProcWatch, the raw kernel interface, and ps provided independent confirmation that the parser and unit conversions were correct.
Scope and limitations
ProcWatch is intentionally Linux-specific and observational. It does not ptrace, inject code, or attempt to replace htop or a debugger. Known limitations include remaining format-string warnings, heuristic presentation of very large virtual sizes, sequential matching assumptions in specialized views, and the absence of a comprehensive automated test suite. Future work can tighten parsing, improve human-readable memory units, add continuous refresh, and expand filtering without changing the core mission.
What the project demonstrates
A process is not a single number. It is kernel-maintained state exposed through multiple /proc files, each with its own format, units, and lifetime rules. ProcWatch turns that raw text into a structured model, derives rates from cumulative counters, and surfaces the results in a usable form.
The artifact is small enough to understand completely yet touches kernel interfaces, positional parsing, virtual-memory accounting, sampling, race handling, multi-file C structure, and Make. The same collection → parse → model → derive → present pipeline appears in monitoring agents, container runtimes, and infrastructure observability systems. That combination is the point of the project.